
In the evolving landscape of DeFi, where Miner Extractable Value (MEV) represents both opportunity and friction, custom MEV redistribution dashboards emerge as indispensable tools for traders, developers, and protocol designers. These dashboards illuminate opaque MEV flows, enabling equitable sharing mechanisms that mitigate extraction risks and enhance market efficiency. By harnessing Dune Analytics for SQL-powered queries and The Graph for decentralized indexing, builders can craft real-time visualizations that drive informed strategies in MEV flow analytics.

The Graph’s native token, GRT, trades at $0.0255, reflecting a modest 24-hour gain of and 0.0101%. This stability underscores the protocol’s enduring utility in data indexing amid fluctuating DeFi sentiments. As MEV strategies proliferate, integrating such price feeds into dashboards provides contextual depth to redistribution metrics.
Decoding MEV Dynamics with Precision Analytics
MEV manifests through arbitrage, liquidations, and sandwich attacks, siphoning value from naive traders. Traditional on-chain explorers fall short in dissecting these patterns; enter Dune Analytics, a powerhouse for Dune Analytics MEV exploration. Its pre-processed tables, like dex. trades and ethereum. transactions, expose labeled MEV events across 100 and blockchains. Querying these datasets reveals not just volume spikes but the validators profiting most, crucial for redistribution protocols aiming to rebate users.
Consider a typical arbitrage cascade on Uniswap: Dune’s SQL interface lets you filter trades by profitability thresholds, aggregating DeFi MEV tools insights. A strategic query might sum gas fees correlated with bundle inclusions, highlighting searchers’ dominance. This data granularity empowers dashboard creators to forecast MEV yields, optimizing share allocations in real-time.
MEV is not merely a byproduct of block production; it is the unseen tax on DeFi liquidity that custom dashboards can democratize.
Setting Up Your Dune Analytics Foundation
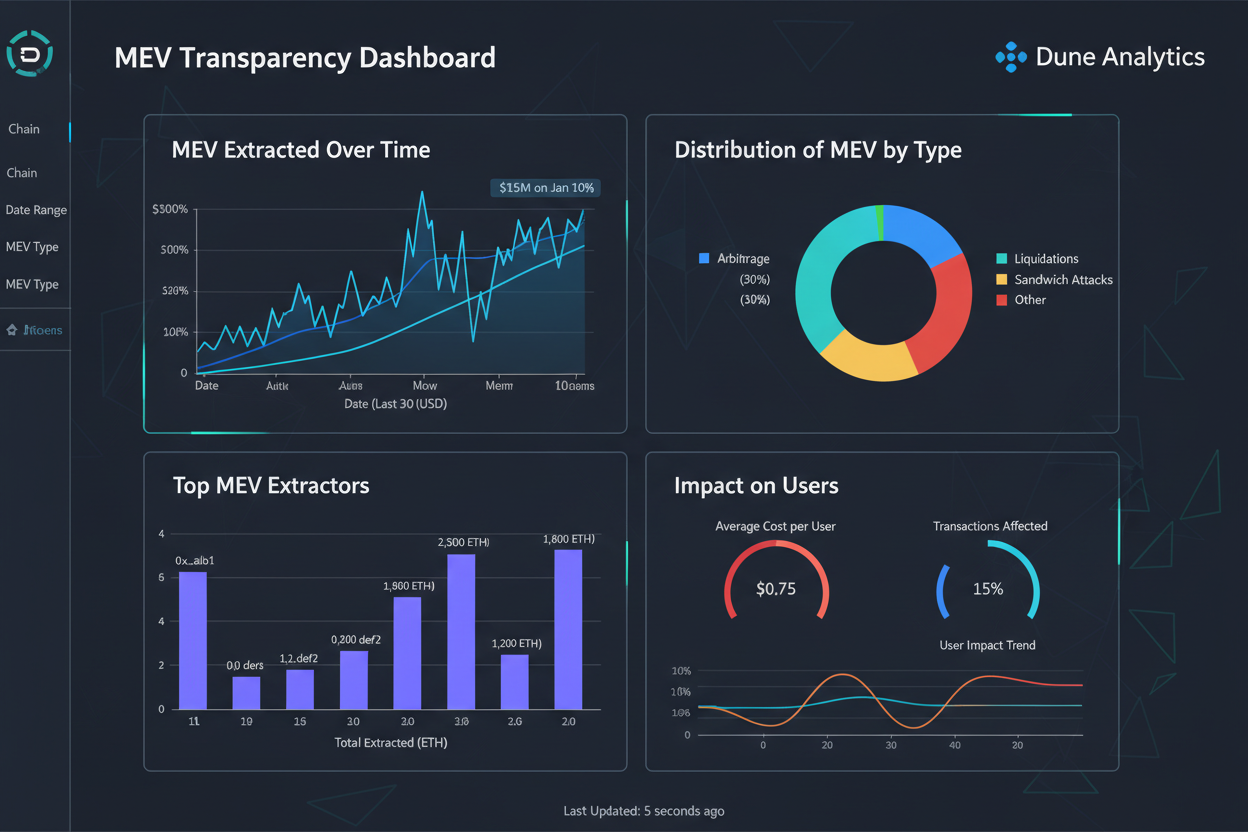
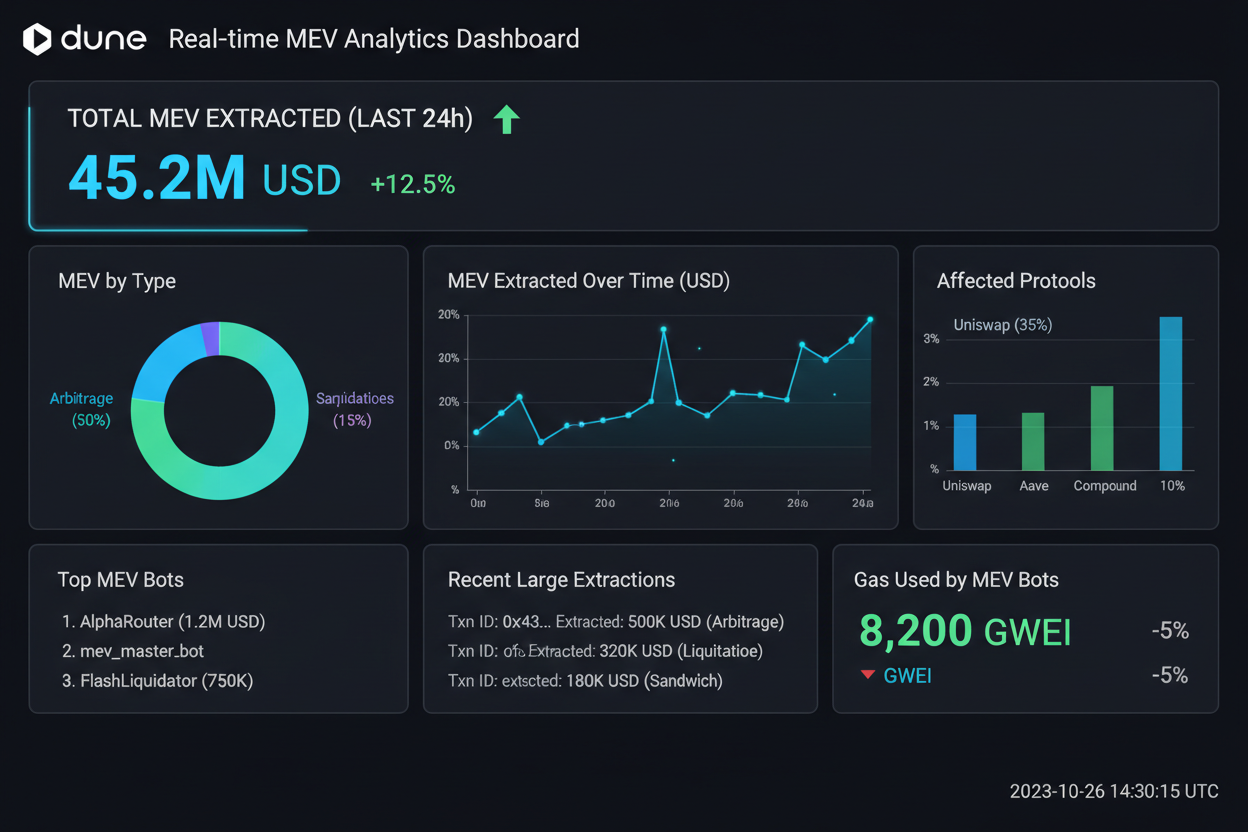
Begin by forking existing Dune Analytics MEV dashboards, such as those tracking Ethereum validator performance or sandwich attack frequencies. Dune’s intuitive editor supports complex joins: pair dex. trades with labels. mev for searcher attribution. Visualize outcomes via charts tracking daily MEV extracted versus redistributed, segmented by protocol.
This query forms the bedrock of your MEV redistribution dashboard. Parameters like time ranges and chain selectors make it dynamic, streaming via APIs for embedding. Dune’s community forks accelerate iteration, blending raw data with intuitive metrics like MEV-per-block or searcher win rates.

Harnessing The Graph for Subgraph-Driven Insights
While Dune excels in historical aggregation, The Graph delivers low-latency queries via subgraphs, perfect for The Graph MEV queries. Deploy a subgraph indexing MEV-boost relays or flashbots bundles, exposing GraphQL endpoints for bundle profitability and inclusion rates. This decentralized layer complements Dune by feeding live data into hybrid dashboards.
For instance, query a custom MEV subgraph for atomic transactions: fetch entities like Bundle { searcher, profit, gasUsed }, then pipe results to Dune for cross-validation. GRT’s price at $0.0255 incentivizes stakers, ensuring subgraph reliability as query volumes surge with DeFi adoption.
The Graph (GRT) Price Prediction 2027-2032
Professional forecasts from current 2026 price of $0.0255, factoring in DeFi adoption, MEV analytics growth, and market cycles
| Year | Minimum Price | Average Price | Maximum Price | YoY % Change (Avg) |
|---|---|---|---|---|
| 2027 | $0.0200 | $0.0450 | $0.0950 | +76.5% |
| 2028 | $0.0300 | $0.0750 | $0.1800 | +66.7% |
| 2029 | $0.0450 | $0.1400 | $0.3500 | +86.7% |
| 2030 | $0.0700 | $0.2200 | $0.5500 | +57.1% |
| 2031 | $0.1000 | $0.3500 | $0.8500 | +59.1% |
| 2032 | $0.1400 | $0.5200 | $1.3000 | +48.6% |
Price Prediction Summary
The Graph (GRT) shows strong long-term potential due to its critical role in decentralized data indexing for DeFi and MEV dashboards. From a 2026 baseline of $0.0255, predictions anticipate gradual recovery in 2027-2028 amid market consolidation, followed by bullish surges in 2029-2032 driven by Web3 adoption. Minimums reflect bearish scenarios like regulatory hurdles; maximums assume peak bull cycles and tech upgrades, with average prices projecting 20x growth by 2032.
Key Factors Affecting The Graph Price
- Increased DeFi and MEV dashboard adoption leveraging The Graph subgraphs and Dune Analytics integration
- Crypto market cycles, with potential bull runs post-2028 Ethereum upgrades
- Technological improvements in indexing efficiency and multi-chain support
- Regulatory developments favoring decentralized data protocols
- Competition from alternative indexers and centralized analytics platforms
- Market cap expansion as Web3 data demands grow exponentially
- Historical volatility patterns and correlation with ETH price movements
Disclaimer: Cryptocurrency price predictions are speculative and based on current market analysis.
Actual prices may vary significantly due to market volatility, regulatory changes, and other factors.
Always do your own research before making investment decisions.
Integrating The Graph elevates dashboards from static reports to proactive tools. Opinionated builders prioritize subgraphs mirroring proprietary MEV pipelines, fostering transparency in redistribution. This synergy unlocks nuanced views: track how MEV from a sandwich attack redistributes as yield rebates, visualized in layered charts.
| Tool | Strength | MEV Use Case |
|---|---|---|
| Dune Analytics | SQL Dashboards | Historical Flow Analysis |
| The Graph | GraphQL Indexing | Real-Time Queries |
Such comparative frameworks guide hybrid builds, ensuring dashboards scale with MEV complexity.
Hybrid architectures demand seamless data pipelines between Dune and The Graph, transforming disparate datasets into cohesive MEV flow analytics narratives. Start by exporting Dune query results via DataShare APIs, then ingest them into a subgraph for GraphQL augmentation. This approach captures historical depth alongside live MEV signals, vital for redistribution protocols that rebate traders in real-time.
Crafting GraphQL Queries for MEV Subgraphs
Deploying a subgraph begins with defining entities in the subgraph. yaml manifest: track MEV bundles as entities with fields like id, searcher address, profit USD, and timestamp. The Graph’s hosted service simplifies deployment, querying via endpoints like https://api.thegraph.com/subgraphs/name/your-mev-subgraph.
This query surfaces top-profitable bundles, ripe for dashboard integration. Feed results into visualization libraries like Apache Superset or Streamlit, correlating with Dune’s aggregated metrics. In my experience managing DeFi portfolios, such precision reveals searcher concentration risks, prompting diversified redistribution pools.
Video tutorials like those dissecting Dune’s MEV tables accelerate learning curves, demystifying bundle mechanics and label integrations. Pair this knowledge with The Graph’s subgraphs for dashboards that not only report but predict MEV surges, adjusting share ratios dynamically.
Advanced Visualizations and Real-Time Streaming
Elevate your MEV redistribution dashboard with layered charts: Sankey diagrams tracing MEV from extraction to rebate distribution, heatmaps of validator performance, and time-series forecasts using Dune’s spellbook abstractions. Stream live updates via The Graph’s subscriptions, websocket-connected to frontend frameworks like React.
These steps yield production-grade tools, scalable across chains like Polygon or Arbitrum where MEV patterns diverge. GRT at $0.0255 supports robust indexing, its 24-hour uptick of 0.0101% signaling quiet confidence in query demand.
| Metric | Dune Query | GraphQL Complement |
|---|---|---|
| Daily MEV Volume | Historical Aggregate | Live Bundle Feeds |
| Searcher Profitability | Label-Based Attribution | Entity-Level Detail |
| Redistribution Efficiency | Custom Joins | Subscription Updates |
Quantitative benchmarks like these anchor strategic decisions, exposing inefficiencies in current MEV markets.
Case Study: A Live Redistribution Dashboard
Imagine a dashboard for a hypothetical MEV-share protocol: top panel streams The Graph’s bundle profits, bottom aggregates Dune’s sandwich impacts on Uniswap liquidity. Alerts trigger at thresholds, say 10% MEV deviation from baseline, notifying stakers for rebalancing. Deployed publicly, it garners forks, evolving through community contributions much like Dune’s ecosystem.
Key Benefits of Custom MEV Dashboards
-
Enhanced transparency in DeFi MEV tools via Dune Analytics‘ SQL queries on curated DEX trades and The Graph subgraphs for verifiable onchain data.
-
Real-time MEV flow analytics for traders using Dune’s API streaming and The Graph’s GraphQL for monitoring arbitrage and sandwich attacks instantly.
-
Equitable value sharing via data-driven rebates, leveraging Dune visualizations and The Graph indexing to track and redistribute MEV fairly across protocols.
-

Risk mitigation against extraction dominance by analyzing validator MEV performance on Dune and integrating The Graph for comprehensive DeFi oversight.
From a portfolio lens, these dashboards shift MEV from adversarial zero-sum to collaborative yield generation. Protocols embedding such views attract capital, as evidenced by rising TVL in fair-launch MEV initiatives.
Strategic foresight favors builders who layer Dune’s breadth with The Graph’s speed, crafting dashboards that not only monitor but reshape MEV economics. As GRT holds steady at $0.0255, the infrastructure ripens for widespread adoption, empowering developers to redistribute value at scale and fortify DeFi’s foundations against opacity.